Monitoring Arch Linux with Prometheus
Posted on ma 29 maart 2021 in Arch Linux
For monitoring the Arch Linux infrastructure we've moved on from Zabbix to Prometheus as it fits more into our infrastructure is code goal. This required some research into how we could achieve the same monitoring with Prometheus. Our Zabbix setup monitored Host, MySQL, Borg and Arch Linux related metrics. For host metrics node_exporter is an excellent solution and mysqld_exporter exists for MySQL. Our Arch Linux where custom Zabbix metrics, which where the number of out date packages and the number of vulnerable installed packages, the Borg metrics is the last backup date of a machine.
For the Borg/Arch Linux metrics there are two options, create a custom exporter which has to be exposed over the network and periodically polled by Prometheus or use node_exporter's textcollector feature. The textcollector feature of node_exporter works by reading additional metrics from a textfile in a given directory, these metrics are then added to the node_exporter metrics.
The textcollector approach suits as well, as we can rely on some shell scripting and systemd for scheduling to provide metrics. To obtain our Arch metrics all we need to run is:
checkupdates | wc -l

arch-audit | wc -l
To make the node_exporter collect the metric we want, we need to pass --collector.textfile.directory=/var/lib/node_exporter and generate a file which looks as following in that directory (readable by the node_exporter user):
# HELP pacman_updates_pending number of pending updates from pacman
# TYPE pacman_updates_pending gauge
pacman_updates_pending 14
# HELP pacman_security_updates_pending number of pending updates from pacman
# TYPE pacman_security_updates_pending gauge
pacman_security_updates_pending 1
This file is in the Prometheus format which is now being standardized as the OpenMetrics specification.
Bringing this all together is a simple bash script which generates the expected output format and dumps it in a pacman.prom file in the user provided directory. This is periodically re-generated with the use of a systemd service and timer. With these metrics we generate alerts for when a server has vulnerable packages installed or has more then 50 outdated packages by these Prometheus rules.
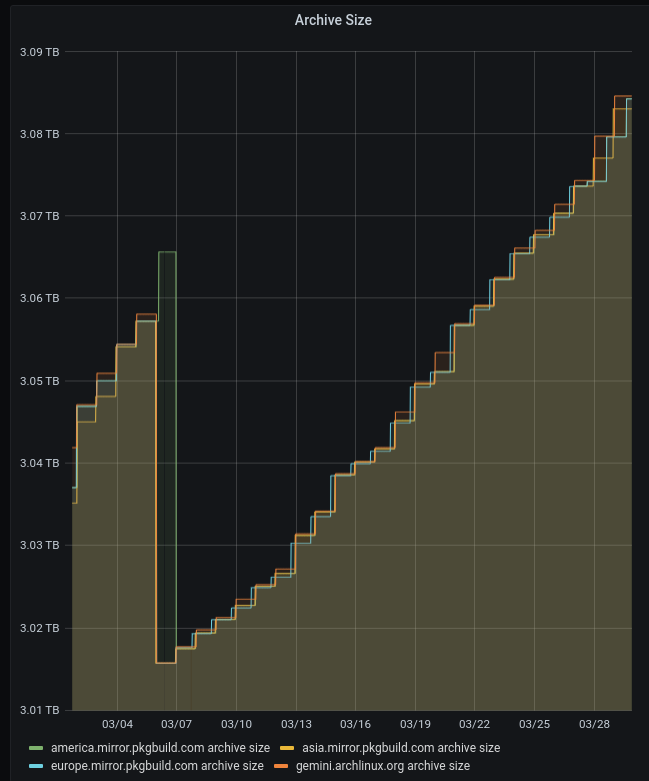
As more modern tools output JSON it's even easier to make a custom textcollector with the help of jq, this allowed us to for example monitor btrfs for errors and rebuilderd. For fun and profit Arch now also monitors the repository sizes using a simple bash script.
In conclusion, node_exporter's textcollector feature makes it fun and easy to monitor additional metrics with Prometheus such as the Arch Linux Archive size :)
